
Technical Scope: No changes in technicals, or fundamentals!
May 21, 2026 at 12:41 PM
Technical Analysis Today: DXY, EUR/USD, GBP/USD, Gold, & S&P500 Outlook
Welcome to today’s edition of The Technical Scope, your twice-weekly guide to the evolving landscape of global markets through the lens of technical analysis. This report focuses on pure price action, highlighting key supply and demand zones, tracking momentum shifts, and identifying potential trading opportunities. Each edition covers major assets, offering a broad view of how currencies, commodities, and equities are performing. When market conditions present interesting setups, additional instruments will also be analyzed to provide deeper insight and actionable context.
Today’s edition presents our technical analysis of the following key assets: DXY, EUR/USD, GBP/USD, Gold, and the S&P500.
Dollar index

4-Hour chart
The Dollar Index chart reveals a powerful bullish continuation following its recent structural reversal from the lower green accumulation zone. Price action has tried to breach the previous immediate resistance at the 99.36 level, turning this former ceiling into a pivotal near-term support floor.
A decisive hold above this 99.36 level is expected to validate the breakout, fueling an impulsive leg higher toward the next major area of liquidity. Traders should monitor the red supply zone situated between 99.90 and 100.20, where heavy institutional selling was previously encountered. A successful challenge of this upper barrier would effectively shift the index from a multi-week bottoming formation into a sustained, long-term bullish trend.
EUR/USD
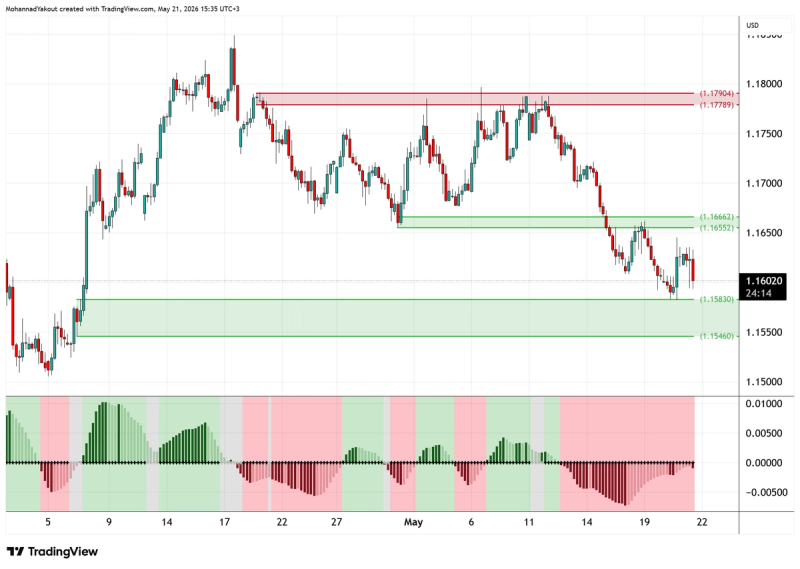
4-Hour chart
The EURUSD chart demonstrates a clear bearish structural shift following a clean breakdown below intermediate support. After a successful break and close below the key demand levels at 1.1650, the pair extended its downward trajectory to tap into the upper boundary of the major green support zone around 1.1583. A temporary intraday bounce is currently underway from this support floor.
Despite this minor relief rally, the bears remain firmly in command of the near-term price action. We expect the pair to eventually exhaust its corrective momentum and push deeper into the 1.1546 – 1.1583 demand zone. This lower floor represents a critical demand area where buyers previously stepped in aggressively. A failure to hold this support could open the floodgates for a deeper structural correction.
GBP/USD
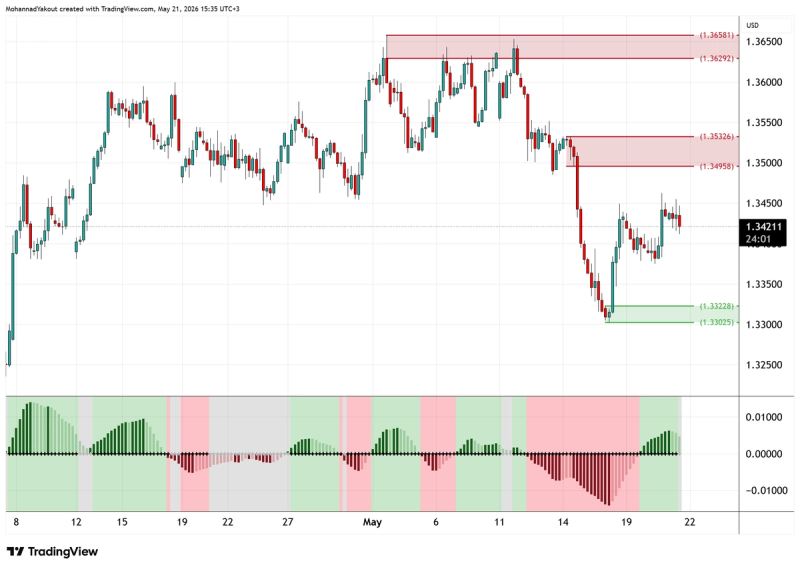
4-Hour chart
The GBPUSD chart highlights a strong defensive reaction from the buyers after the price successfully tapped into the major green demand zone between 1.3300 and 1.3320. Following that sharp multi-day sell-off, the influx of buy orders has driven a constructive, multi-day corrective move higher, with price currently pressing toward the 1.3450 intermediate hurdle.
Consequently, the corrective move higher is expected to continue unfolding over the coming sessions, with the pair ultimately targeting the primary red resistance zone around 1.3500. This recovery phase will serve as a crucial test for the bulls to determine if this bounce is merely a counter-trend relief rally or the beginning of a more permanent structural reversal. Sellers will likely look to defend this upper supply area heavily to maintain the dominant bearish trend.
Gold
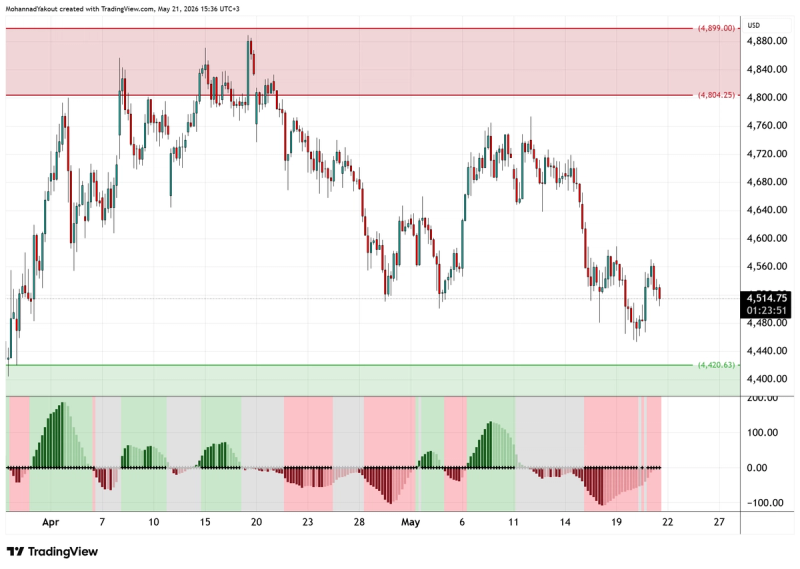
4-Hour chart
The XAUUSD chart exhibits a persistent bearish slide as the precious metal continues to face heavy selling pressure away from its upper red supply boundaries. While the price recently staged a minor intraday bounce after grinding through minor liquidity pools, it remains structurally weak, carving out a series of lower highs and lower lows.
Given this sustained downside momentum, the current bounce is expected to face early rejection, leading to a further move lower to test the immediate green demand cushion at the 4420 level. This technical target serves as the first line of major defense for longer-term bulls, where short-term profit-taking from sellers might trigger a temporary pause. A decisive break below this 4420 floor, however, would signal a broader macro-structural breakdown, exposing deeper support targets.
S&P 500
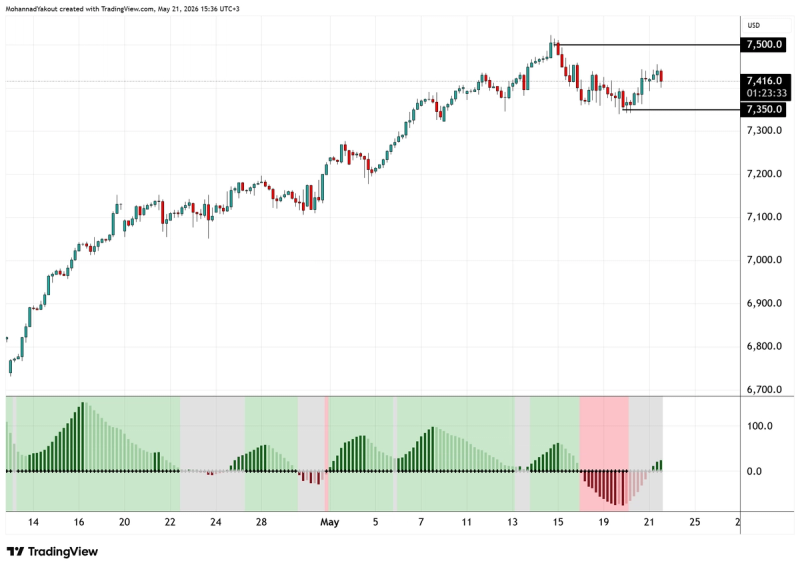
4-Hour chart
The US500 chart indicates a short-term correction from its recent psychological peaks near 7,500. However, instead of securing a decisive breakdown, the index found a firm intra-week floor at the 7,350 horizontal support level, sparking a slight bullish recovery back up toward the 7,416 mark.
Despite this recent resilience and the constructive intraday bounce, the market's broader corrective structure remains heavy. We still expect a decisive break below this immediate 7,350 floor during upcoming sessions once this relief rally exhausts itself, which would officially confirm a short-term bearish reversal pattern. Such a breakdown would pave the way for a deeper decline to test the next major psychological support level around 7,250.
This material is a marketing communication provided for informational purposes only and does not constitute investment advice, recommendation, or an offer or solicitation to trade. Any market analysis, opinions, or forecasts are based on publicly available information and do not constitute independent investment research. Past performance and forecasts are not reliable indicators of future results. Scope Markets accepts no liability for any loss arising from reliance on this information.
Related Articles

Technical Scope: The Strong Dollar Effect
By Mohanad Yakout
Welcome to today’s edition of The Technical Scope, your twice-weekly guide to the evolving landscape of global markets through the lens of technical a...
Read More
Market Analysis
Technical Analysis

Technical Scope: Markets stuck in a sideways range
By Mohanad Yakout
Welcome to today’s edition of The Technical Scope, your twice-weekly guide to the evolving landscape of global markets through the lens of technical a...
Read More
Market Analysis
XAUUSD
USDJPY
US 500
Trend Following
Technical Analysis
Swing Trading
Support And Resistance

Stop Trading the News, Start Trading the Oil Cargo
By Victor Golovtchenko
When you see a Reuters headline that tells you OPEC+ is "completing the series of symbolic quota hikes," what exactly are you trading? When the Irania...
Read More
Market Analysis
Oil
US Oil
UK oil
WTI
Brent Crude
Trading

Technical Scope: Markets Mixed Ahead of Key Developments
By Mohanad Yakout
Welcome to today’s edition of The Technical Scope, your twice-weekly guide to the evolving landscape of global markets through the lens of technical a...
Read More
Market Analysis
XAUUSD
USDJPY
US 500
Trend Following
Technical Analysis
Swing Trading
Support And Resistance
Technical Scope: Key Levels & Market Outlook ahead of NFP Data
By Mohanad Yakout
Welcome to today’s edition of The Technical Scope, your twice-weekly guide to the evolving landscape of global markets through the lens of technical a...
Read More
Market Analysis
Chart Patterns
Candlestick Patterns
Day Trading
GBPUSD
Gold
NFP
Non Farm Payrolls
EURUSD
Oil
S&P 500
US 500
USDJPY
XAUUSD
The state of Hormuz: oil price action is not the story
By Victor Golovtchenko
Another month, another week, another batch of headlines, and new all-time highs for US stock markets might not be the news one awaits when they see th...
Read More
Market Analysis
Oil
WTI
Brent Crude
Strait of Hormuz
UAE
OPEC
Technical Scope: Key levels to watch for on JPY pairs
By Mohanad Yakout
Welcome to today’s edition of The Technical Scope, your twice-weekly guide to the evolving landscape of global markets through the lens of technical a...
Read More
Market Analysis
Technical Analysis
Day Trading
Chart Patterns
EURUSD
GBPUSD
Crude Oil
S&P 500
Gold

Beyond oil & gold: sector rotation from AI-centric to energy-centric
By Victor Golovtchenko
The vulnerability of the Strait of Hormuz which is handling 20% of global oil flows and a massive share of Qatar’s liquified natural gas (LNG) exports...
Read More
Market Analysis
Stocks
Energy
Tesla

Beyond oil & gold: mapping forex markets in turbulent times
By Victor Golovtchenko
The financial world has understandably been captivated by the extraordinary surge in gold to above $5,000 in the first weeks of 2026 and the looming t...
Read More
Market Analysis
forex
Oil
Gold
Straight of Hormuz
Iran