



Technical Scope: Markets stuck in a sideways range
May 14, 2026 at 2:02 PM
Technical Analysis Today: EUR/USD, GBP/USD, Gold, Brent Crude & S&P 500 Outlook
Welcome to today’s edition of The Technical Scope, your twice-weekly guide to the evolving landscape of global markets through the lens of technical analysis. This report focuses on pure price action, highlighting key supply and demand zones, tracking momentum shifts, and identifying potential trading opportunities. Each edition covers major assets, offering a broad view of how currencies, commodities, and equities are performing. When market conditions present interesting setups, additional instruments will also be analyzed to provide deeper insight and actionable context.
Today’s edition presents our technical analysis of the following key assets: DXY, EUR/USD, GBP/USD, Gold, Brent Crude, and the S&P500. In addition, we highlight selected opportunities where technical conditions stand out, including an additional instrument USD/JPY.
Dollar Index
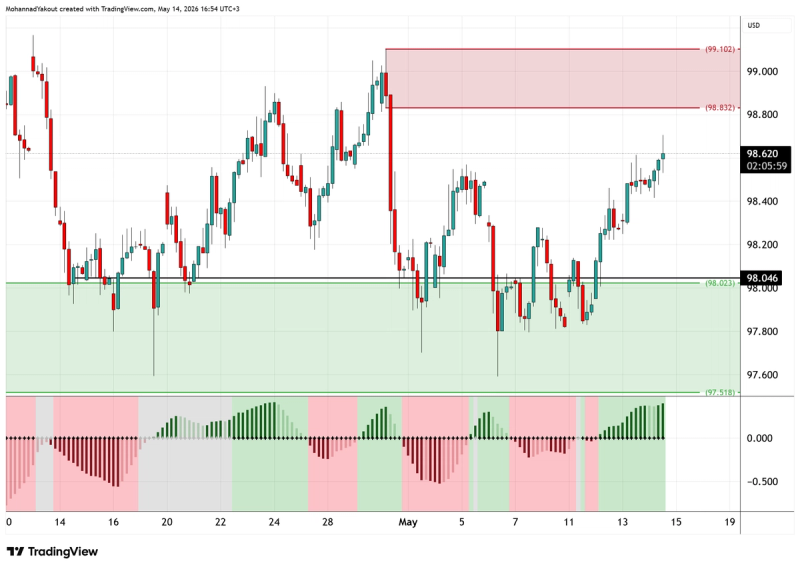
4-Hour Chart
The Dollar index chart reveals a significant structural recovery following a successful defense of the green support zone between 97.50 and 98.0. Price is currently in an impulsive "retest" phase of the local highs, supported by a momentum indicator that shows expanding green histograms, signaling that bulls are firmly in the driver’s seat. We expect the index to move higher to the red supply zone at 98.80; a decisive close above this area would verify the shift from a bottoming formation to a sustained bullish trend.
EUR/USD
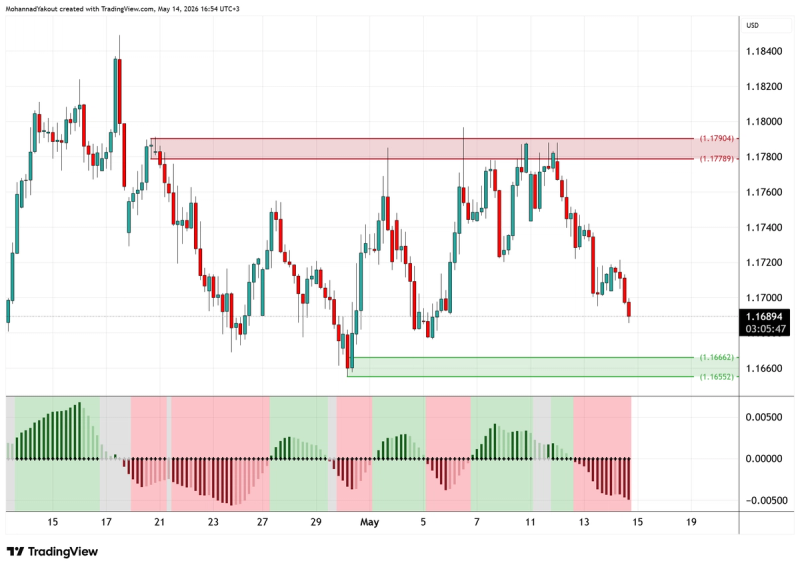
4-Hour Chart
The EURUSD pair has undergone a bearish pivot after facing a stiff rejection at the 1.1780 supply ceiling. This rejection is reinforced by the momentum indicator, which has transitioned into deep red histograms, suggesting that the recent relief rally was merely a "dead cat bounce". We anticipate a move lower to the demand zone at 1.1670. If price fails to find significant buying interest here, it would verify a breakdown below the 1.1655 level as the broader bearish retracement resumes.
GBP/USD
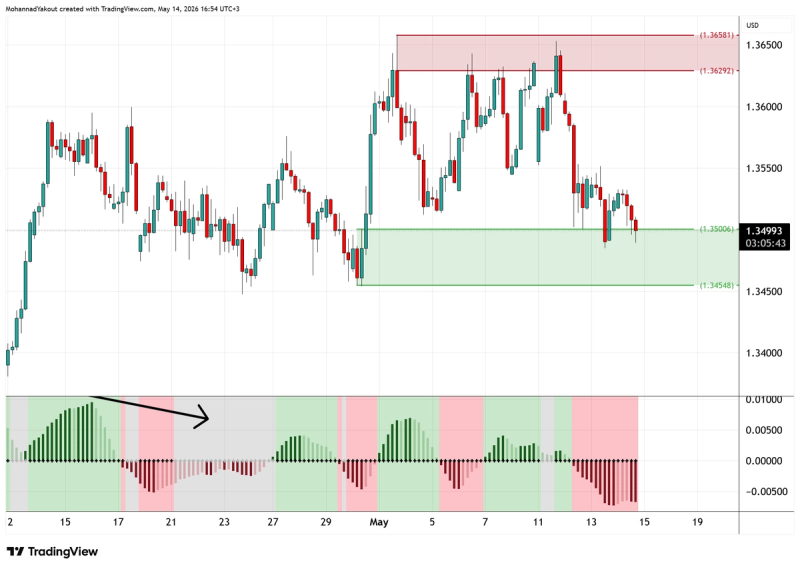
4-Hour Chart
The GBPUSD chart shows Cable entering a critical "retest" phase as it dips into the green demand zone. While the momentum indicator displays a clear bullish divergence, the structural floor at the bottom of this zone remains the primary focus. We expect that price might move lower inside this demand zone, but we view the 1.3450 level as the ultimate limit for this correction. A failure to break below this threshold would verify the zone as a new base for a potential bullish reversal.
Gold
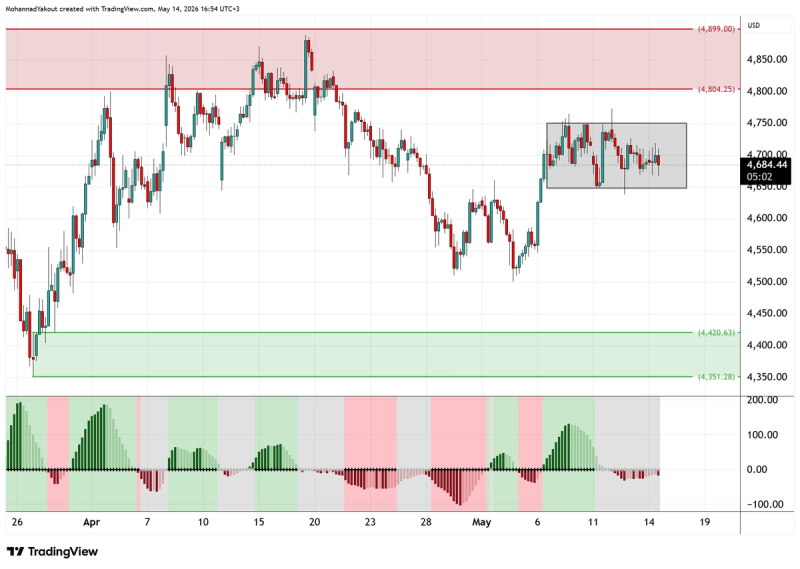
4-Hour Chart
As seen on the 4-Hour chart, Gold is currently building energy within a grey consolidation box, acting as a "bull flag" after the sharp move higher in early May. This sideways action is a classic verify phase; the market is absorbing supply before the next leg up. We look for a breakout toward 4750. Once price clears this immediate resistance and flips it to support, the target will shift to the major psychological and technical level of 4800.
Brent Crude
4-Hour Chart
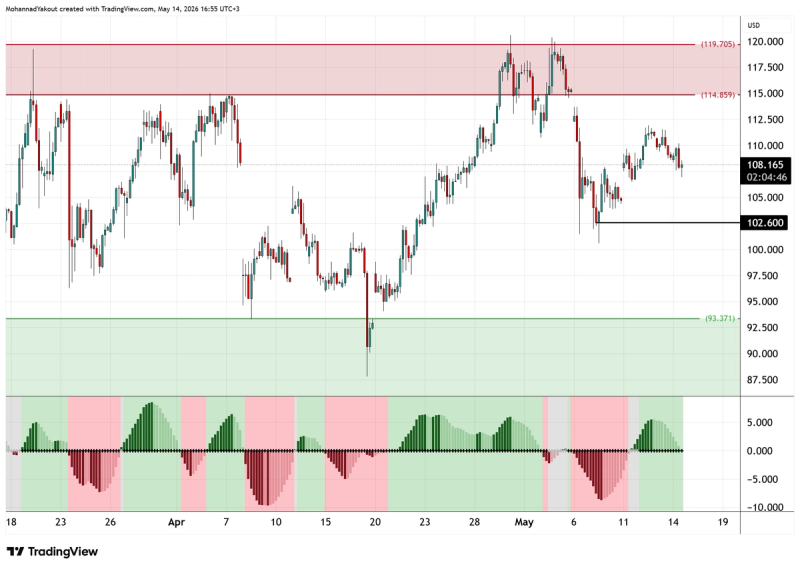
The Brent crude chart reveals a loss of bullish conviction after price failed to maintain its footing above the 115.00 mark. The momentum histograms are currently oscillating near the zero line, indicating a lack of aggressive buying at current valuations. We expect a bearish continuation to move lower toward the last structural low at 102.60. Reaching this level would verify if the recent uptrend has been completely neutralized, potentially opening the door for a deeper test of the 93.37 support zone.
S&P 500
4-Hour Chart
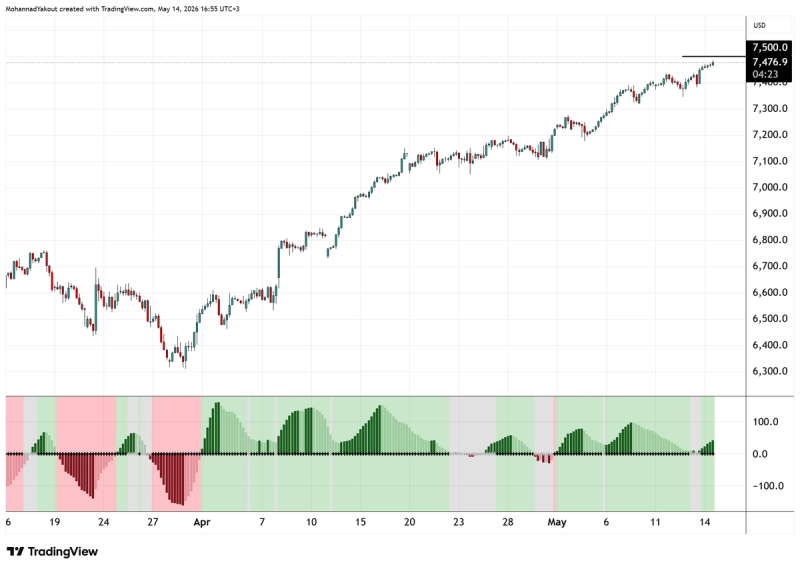
The US500 index remains in a parabolic "discovery" phase, characterized by slightly bullish momentum and a series of higher highs. However, the vertical nature of this rally suggests we are approaching an exhaustion point. Our primary target is 7500. Upon hitting this milestone, we expect to see a significant technical retracement as the market seeks to verify lower support levels. Such a pullback would be necessary to validate the sustainability of the current bull run.
USD/JPY
4-Hour Chart
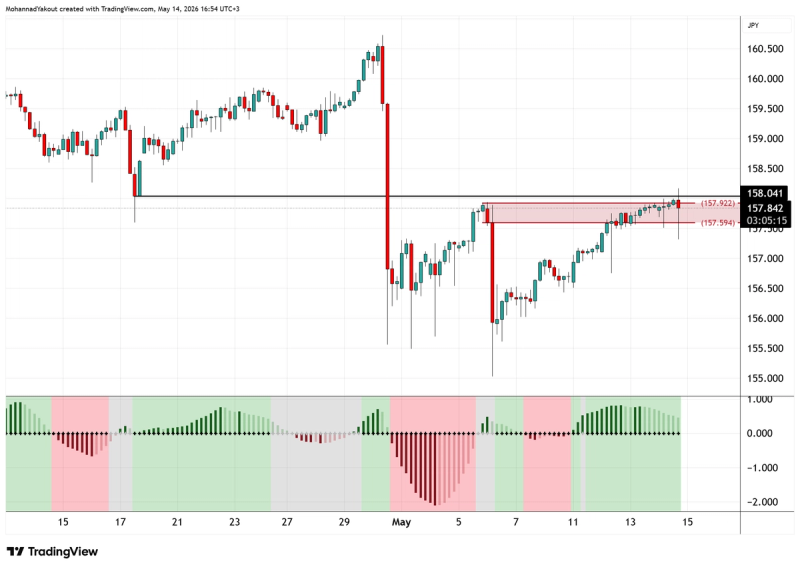
The USD/JPY pair is currently testing the limits of its recent recovery as it trades near critical supply at 158.00. The red supply zone between 157.60 and 158.00 is acting as a firm overhead ceiling. Given the diminishing size of the green momentum histograms as price enters this zone, the "path of least resistance" appears to be shifting. We expect to see a retracement lower from this area, which would verify that the supply at 158.00 remains a formidable barrier for USD bulls.
This material is a marketing communication provided for informational purposes only and does not constitute investment advice, recommendation, or an offer or solicitation to trade. Any market analysis, opinions, or forecasts are based on publicly available information and do not constitute independent investment research. Past performance and forecasts are not reliable indicators of future results. Scope Markets accepts no liability for any loss arising from reliance on this information.
Related Articles

Technical Scope: Markets Await Fresh Catalysts
By Mohanad Yakout
Welcome to today’s edition of The Technical Scope, your twice-weekly guide to the evolving landscape of global markets through the lens of technical a...
Read More
Market Analysis
Swing Trading
Technical Analysis

Technical Scope: Markets see trend continuations
By Mohanad Yakout
Welcome to today’s edition of The Technical Scope, your twice-weekly guide to the evolving landscape of global markets through the lens of technical a...
Read More
Market Analysis
Swing Trading
Technical Analysis

Technical Scope: Price Action Ahead of the Peace Summit
By Mohanad Yakout
Welcome to today’s edition of The Technical Scope, your twice-weekly guide to the evolving landscape of global markets through the lens of technical a...
Read More
Market Analysis
Price Action
Swing Trading
Technical Analysis

Technical Scope: The Sideways trading continues
By Mohanad Yakout
Welcome to today’s edition of The Technical Scope, your twice-weekly guide to the evolving landscape of global markets through the lens of technical a...
Read More
Market Analysis
Swing Trading
Technical Scope: No changes in technicals, or fundamentals!
By Mohanad Yakout
Welcome to today’s edition of The Technical Scope, your twice-weekly guide to the evolving landscape of global markets through the lens of technical a...
Read More
Market Analysis
Technical Analysis
Swing Trading
Technical Scope: The Strong Dollar Effect
By Mohanad Yakout
Welcome to today’s edition of The Technical Scope, your twice-weekly guide to the evolving landscape of global markets through the lens of technical a...
Read More
Market Analysis
Technical Analysis

Stop Trading the News, Start Trading the Oil Cargo
By Victor Golovtchenko
When you see a Reuters headline that tells you OPEC+ is "completing the series of symbolic quota hikes," what exactly are you trading? When the Irania...
Read More
Market Analysis
Oil
US Oil
UK oil
WTI
Brent Crude
Trading

Technical Scope: Markets Mixed Ahead of Key Developments
By Mohanad Yakout
Welcome to today’s edition of The Technical Scope, your twice-weekly guide to the evolving landscape of global markets through the lens of technical a...
Read More
Market Analysis
XAUUSD
USDJPY
US 500
Trend Following
Technical Analysis
Swing Trading
Support And Resistance
Technical Scope: Key Levels & Market Outlook ahead of NFP Data
By Mohanad Yakout
Welcome to today’s edition of The Technical Scope, your twice-weekly guide to the evolving landscape of global markets through the lens of technical a...
Read More
Market Analysis
Chart Patterns
Candlestick Patterns
Day Trading
GBPUSD
Gold
NFP
Non Farm Payrolls
EURUSD
Oil
S&P 500
US 500
USDJPY
XAUUSD
The state of Hormuz: oil price action is not the story
By Victor Golovtchenko
Another month, another week, another batch of headlines, and new all-time highs for US stock markets might not be the news one awaits when they see th...
Read More
Market Analysis
Oil
WTI
Brent Crude
Strait of Hormuz
UAE
OPEC