
Technical Scope: The Strong Dollar Effect
May 19, 2026 at 1:59 PM
Technical Analysis Today: DXY, EUR/USD, GBP/USD, Gold, WTI, USDJPY & S&P500 Outlook
Welcome to today’s edition of The Technical Scope, your twice-weekly guide to the evolving landscape of global markets through the lens of technical analysis. This report focuses on pure price action, highlighting key supply and demand zones, tracking momentum shifts, and identifying potential trading opportunities. Each edition covers major assets, offering a broad view of how currencies, commodities, and equities are performing. When market conditions present interesting setups, additional instruments will also be analyzed to provide deeper insight and actionable context.
Today’s edition presents our technical analysis of the following key assets: DXY, EUR/USD, GBP/USD, Gold, WTI Crude, and the S&P500. In addition, we highlight selected opportunities where technical conditions stand out, including an additional instrument USD/JPY.
Dollar Index
4-Hour Chart
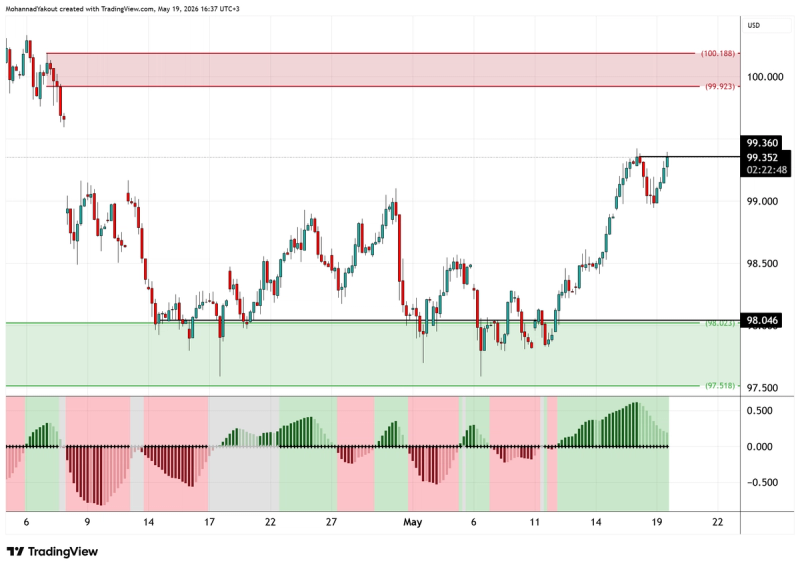
The Dollar Index chart reveals a powerful bullish continuation following its recent structural breakout from the lower green accumulation zone. Price action is currently pushing into immediate resistance at the 99.35 level, forming a highly constructive consolidation just beneath this local peak.
A decisive daily close above this 99.35 ceiling is expected to validate a clean breakout, triggering an impulsive leg higher toward the next major area of liquidity. Traders should monitor the red supply zone situated around the 99.90 mark, where heavy institutional selling was previously encountered. A successful challenge of this upper barrier would effectively shift the index from a multi-week bottoming formation into a sustained, long-term bullish trend.
EURUSD
4-Hour Chart
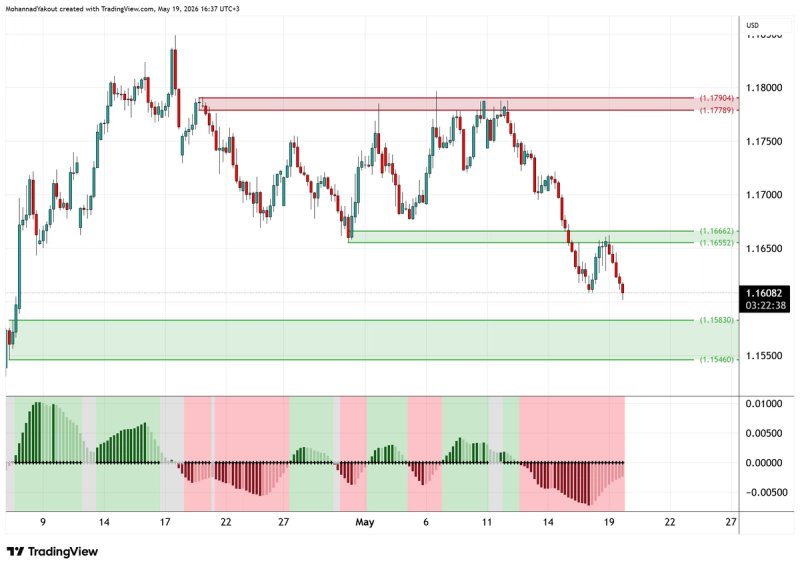
The EURUSD chart demonstrates a clear bearish structural shift following a clean breakdown below intermediate support. After a successful break and close below the key demand levels at 1.1650, the pair executed a textbook retest of this breached zone from underneath, turning old support into a formidable new resistance ceiling.
With the bears firmly commanding the near-term price action, we expect the pair to extend its downward trajectory to test the next major green support zone located around 1.1580. This lower floor represents a critical historical demand area where buyers previously stepped in aggressively. A failure to hold this support could open the floodgates for a deeper structural correction, while a temporary pause or consolidation at this level is highly probable.
GBPUSD
4-Hour Chart
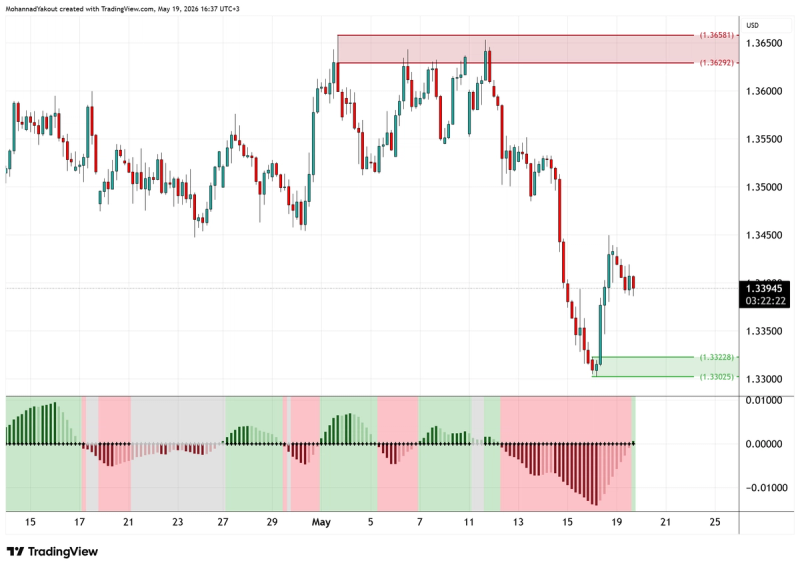
The GBPUSD chart highlights a strong defensive reaction from the buyers as the price successfully taps into the major green demand zone between 1.3302 and 1.3322. Following a sharp multi-day sell-off, this structural floor has triggered an influx of buy orders, leading to a constructive intraday rebound.
Consequently, another corrective move higher is expected to unfold over the coming sessions, with the pair targeting local resistance levels around 1.3550. This recovery phase will serve as a crucial test for the bulls to determine if this bounce is merely a counter-trend relief rally or the beginning of a more permanent structural reversal. Sellers will likely look to defend the 1.3550 area heavily to maintain the dominant bearish trend.
USDJPY
4-Hour Chart
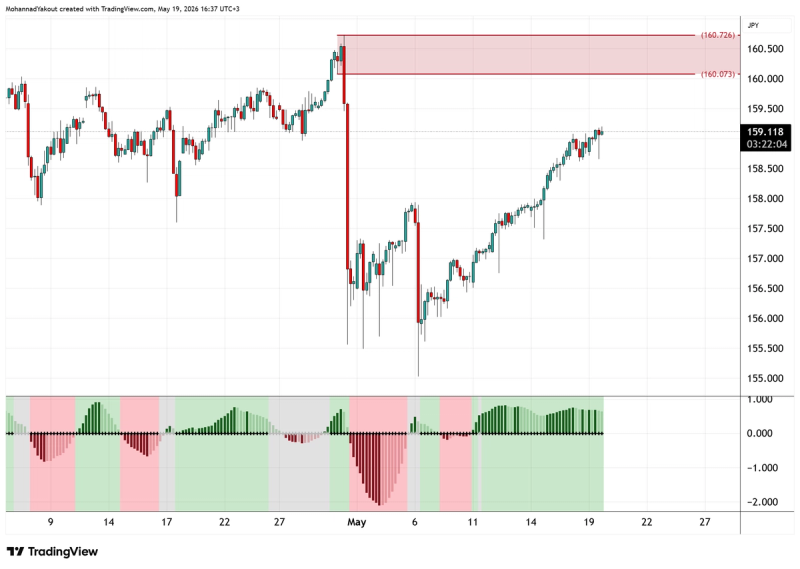
The USDJPY chart reveals a steady, grinding recovery following its dramatic, high-volume sell-off observed in late April. The pair has successfully stabilized and is carving out a consistent ascending channel, systematically reclaiming lost ground.
Despite the lack of explosive momentum, the broader bullish market structure remains entirely intact as the pair prints a steady cadence of higher lows. We expect the pair to maintain this gradual, grinding ascent to test the key red supply zone at the 160.00 handle. This psychological level remains a critical battleground for the pair, and price action upon arrival will dictate whether a double-top structure forms or a full bullish breakout occurs.
WTI Crude
4-Hour Chart
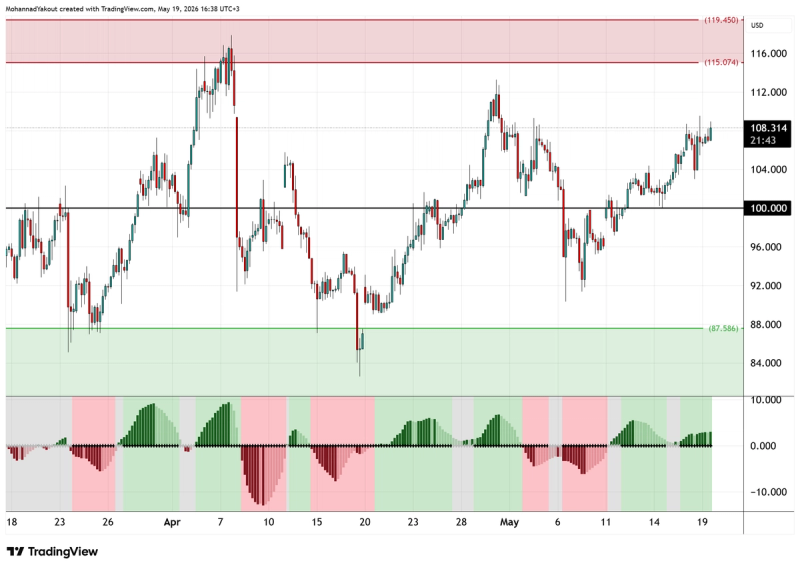
The Spot Crude chart showcases a textbook example of a sideways trend, with the commodity recently steadily climbing well above the psychological 100.00 threshold. The price structure remains highly impulsive, characterized by shallow corrections that are quickly bought up by trend-following participants.
We expect the commodity to maintain its strong upward velocity and register another leg higher to test the major red supply zone around the 115.00 mark. This upcoming resistance zone represents a significant historical inflection point that could induce heightened volatility and potential profit-taking. Until the price prints a clear bearish reversal structure near this 112.00 target, the path of least resistance remains firmly to the upside.
Gold
4-Hour Chart
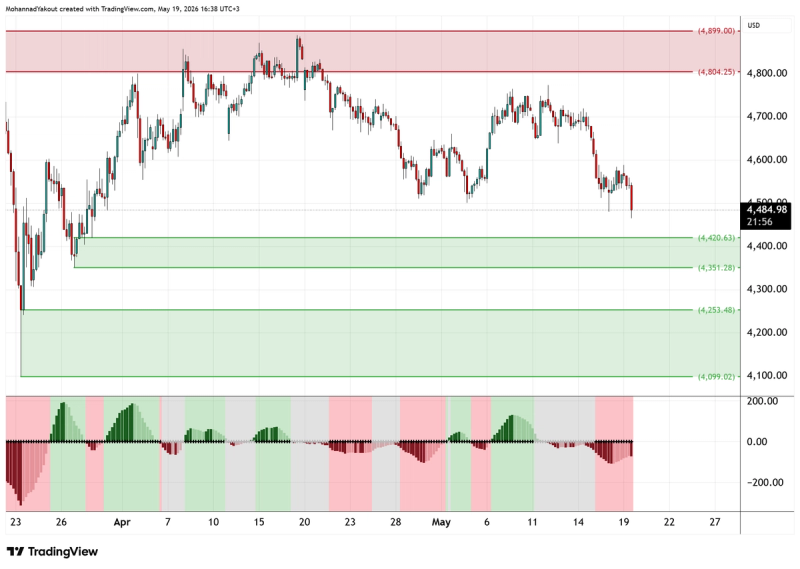
The XAUUSD chart exhibits a persistent bearish slide as the precious metal continues to face heavy selling pressure away from its upper red supply boundaries. The price action is carving out a series of lower highs and lower lows, grinding through minor support levels with very little bullish divergence.
Given this sustained downside momentum, a further move lower is expected to test the immediate green demand cushion at the 4420 level. This technical target serves as the first line of major defense for longer-term bulls, where short-term profit-taking from sellers might trigger a temporary pause. A decisive break below this 4420 floor, however, would signal a broader macro-structural breakdown, exposing deeper support targets.
S&P500
4-Hour Chart
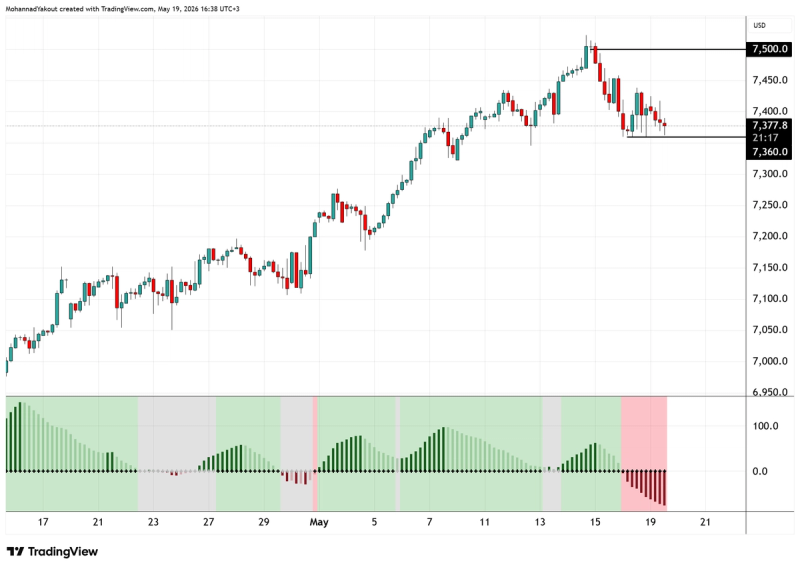
The US500 chart indicates a sharp near-term correction from its recent psychological peaks near 7,500, with the index currently pressing hard against immediate horizontal support at 7360. The speed of this descent has caught the market off guard, wiping out several days of gains in a rapid re-pricing event.
We expect a decisive break below this immediate 7360 floor during upcoming sessions, which would officially confirm a short-term bearish reversal pattern. Such a breakdown would pave the way for a deeper decline to test the next major psychological support level around 7250. Market participants should watch for an increase in volume upon a breach of 7360, as it would likely accelerate the slide toward our downside target.
This material is a marketing communication provided for informational purposes only and does not constitute investment advice, recommendation, or an offer or solicitation to trade. Any market analysis, opinions, or forecasts are based on publicly available information and do not constitute independent investment research. Past performance and forecasts are not reliable indicators of future results. Scope Markets accepts no liability for any loss arising from reliance on this information.
Related Articles

Technical Scope: Markets Await Fresh Catalysts
By Mohanad Yakout
Welcome to today’s edition of The Technical Scope, your twice-weekly guide to the evolving landscape of global markets through the lens of technical a...
Read More
Market Analysis
Swing Trading
Technical Analysis

Technical Scope: Markets see trend continuations
By Mohanad Yakout
Welcome to today’s edition of The Technical Scope, your twice-weekly guide to the evolving landscape of global markets through the lens of technical a...
Read More
Market Analysis
Swing Trading
Technical Analysis

Technical Scope: Price Action Ahead of the Peace Summit
By Mohanad Yakout
Welcome to today’s edition of The Technical Scope, your twice-weekly guide to the evolving landscape of global markets through the lens of technical a...
Read More
Market Analysis
Price Action
Swing Trading
Technical Analysis

Technical Scope: The Sideways trading continues
By Mohanad Yakout
Welcome to today’s edition of The Technical Scope, your twice-weekly guide to the evolving landscape of global markets through the lens of technical a...
Read More
Market Analysis
Swing Trading
Technical Scope: No changes in technicals, or fundamentals!
By Mohanad Yakout
Welcome to today’s edition of The Technical Scope, your twice-weekly guide to the evolving landscape of global markets through the lens of technical a...
Read More
Market Analysis
Technical Analysis
Swing Trading
Technical Scope: Markets stuck in a sideways range
By Mohanad Yakout
Welcome to today’s edition of The Technical Scope, your twice-weekly guide to the evolving landscape of global markets through the lens of technical a...
Read More
Market Analysis
XAUUSD
USDJPY
US 500
Trend Following
Technical Analysis
Swing Trading
Support And Resistance

Stop Trading the News, Start Trading the Oil Cargo
By Victor Golovtchenko
When you see a Reuters headline that tells you OPEC+ is "completing the series of symbolic quota hikes," what exactly are you trading? When the Irania...
Read More
Market Analysis
Oil
US Oil
UK oil
WTI
Brent Crude
Trading

Technical Scope: Markets Mixed Ahead of Key Developments
By Mohanad Yakout
Welcome to today’s edition of The Technical Scope, your twice-weekly guide to the evolving landscape of global markets through the lens of technical a...
Read More
Market Analysis
XAUUSD
USDJPY
US 500
Trend Following
Technical Analysis
Swing Trading
Support And Resistance
Technical Scope: Key Levels & Market Outlook ahead of NFP Data
By Mohanad Yakout
Welcome to today’s edition of The Technical Scope, your twice-weekly guide to the evolving landscape of global markets through the lens of technical a...
Read More
Market Analysis
Chart Patterns
Candlestick Patterns
Day Trading
GBPUSD
Gold
NFP
Non Farm Payrolls
EURUSD
Oil
S&P 500
US 500
USDJPY
XAUUSD
The state of Hormuz: oil price action is not the story
By Victor Golovtchenko
Another month, another week, another batch of headlines, and new all-time highs for US stock markets might not be the news one awaits when they see th...
Read More
Market Analysis
Oil
WTI
Brent Crude
Strait of Hormuz
UAE
OPEC