
Technical Scope: Key Levels & Market Outlook ahead of NFP Data
May 8, 2026 at 10:27 AM
Technical Analysis Today: EUR/USD, GBP/USD, Gold, WTI Crude & S&P 500 Outlook
Welcome to today’s edition of The Technical Scope, your twice-weekly guide to the evolving landscape of global markets through the lens of technical analysis. This report focuses on pure price action, highlighting key supply and demand zones, tracking momentum shifts, and identifying potential trading opportunities. Each edition covers major assets, offering a broad view of how currencies, commodities, and equities are performing. When market conditions present interesting setups, additional instruments will also be analyzed to provide deeper insight and actionable context.
Today’s edition presents our technical analysis of the following key assets: DXY, EUR/USD, GBP/USD, Gold, WTI Crude, and the S&P500. In addition, we highlight selected opportunities where technical conditions stand out, including an additional instrument USD/JPY.
Dollar index
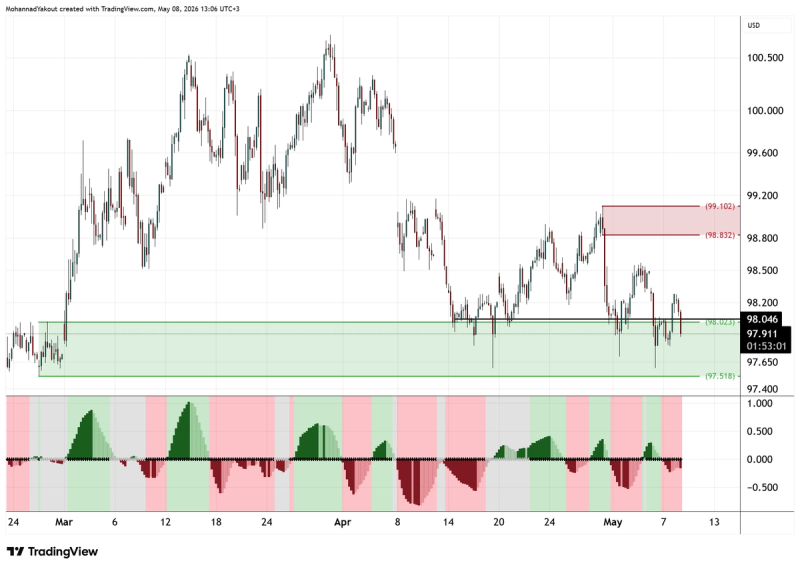
4-Hour Chart
The current H4 timeframe chart on the USDX indicates price is consolidating within a significant demand zone between 97.50 and 98.00. This consolidation follows a steady decline from April highs, and the momentum indicator reflects this shift with bearish histograms expanding below the zero line, suggesting that selling pressure remains dominant.
The broader market structure suggests that the index is testing the floor of its recent range. Consequently, a move lower is expected if the index fails to attract buyers at these levels. A sustained break below the 97.50 demand boundary would confirm a bearish continuation, likely leading to a deeper search for liquidity at lower price levels.
EUR/USD
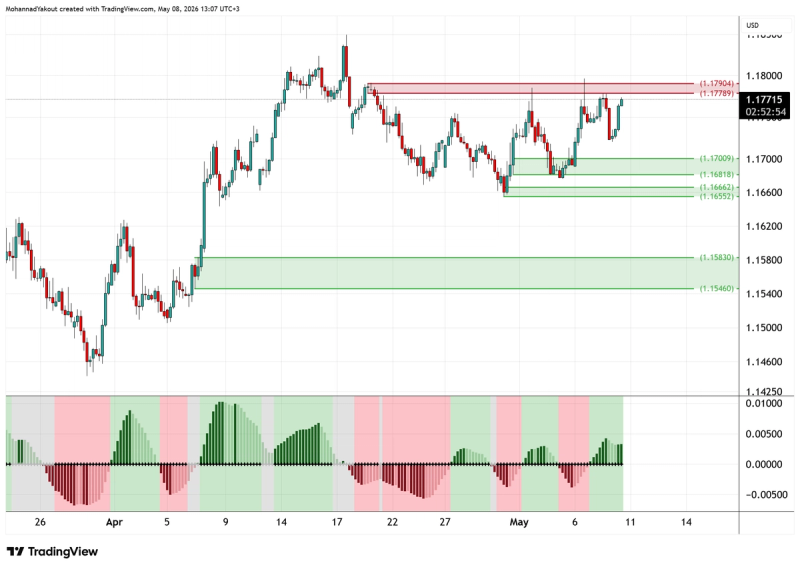
4-Hour Chart
On the H4 timeframe, EUR/USD is currently challenging a critical but also a minor supply zone defined between 1.1780 and 1.1790. The momentum indicator shows a healthy bullish trend, with histograms maintaining a positive trajectory above the midline, suggesting that the underlying buying interest remains strong despite the proximity to resistance.
The price action indicates a potential for an upside breakout as the pair maintains its higher-low structure. A definitive close above the 1.1790 level would validate the bullish bias, signaling that the supply has been absorbed and opening the door for a continuation of the rally toward higher liquidity areas.
GBP/USD
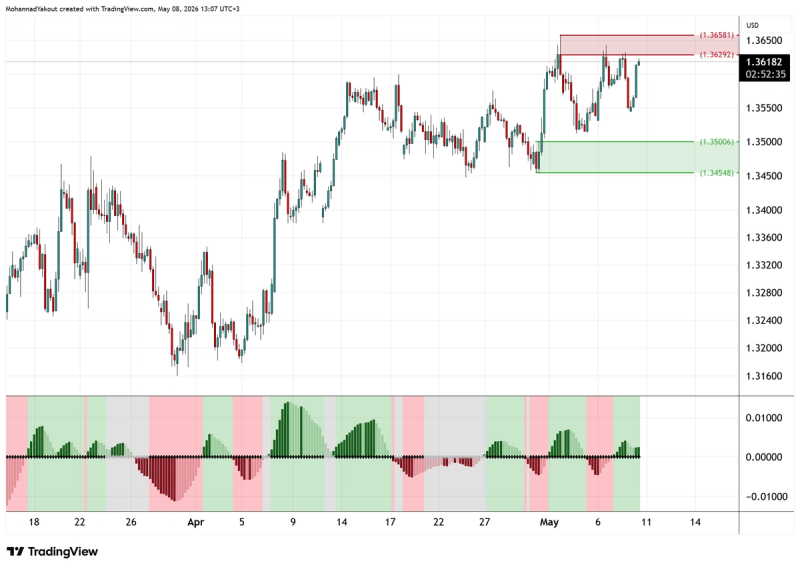
4-Hour Chart
The current H4 timeframe chart on GBP/USD illustrates price action pressing into a supply zone located between 1.3630 and 1.3660. While the momentum indicator remains in bullish territory, price is currently navigating a period of local consolidation just below the resistance ceiling, reflecting a temporary battle between bulls and bears.
The market structure remains constructive, suggesting that buyers are attempting to maintain control of the near-term trend. To confirm a bullish continuation, traders should monitor for a clean break above the 1.3660 mark. Such a move would indicate a successful breakout from the supply zone and likely trigger a fresh leg higher.
Gold
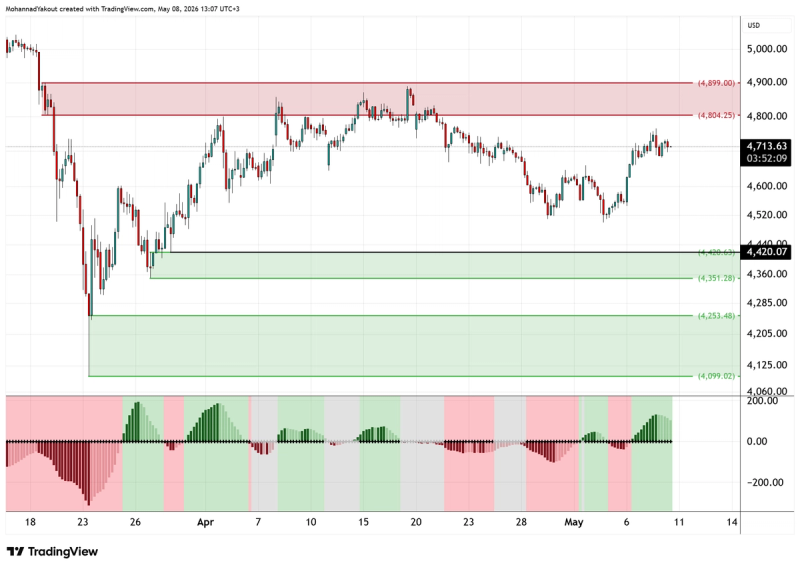
4-Hour Chart
Gold’s H4 chart shows a steady recovery phase following a period of consolidation above the lower demand levels. The momentum indicator has turned positive, printing green histograms that support the current upward move, indicating that sentiment is shifting back in favor of the bulls.
The price action suggests that the market is aiming for a retest of the prominent supply zone located between 4,800 and 4,900. As long as the current momentum persists and price maintains its immediate support levels, the path of least resistance appears to be higher, with the primary objective being a challenge of that upper resistance boundary.
Spot Crude
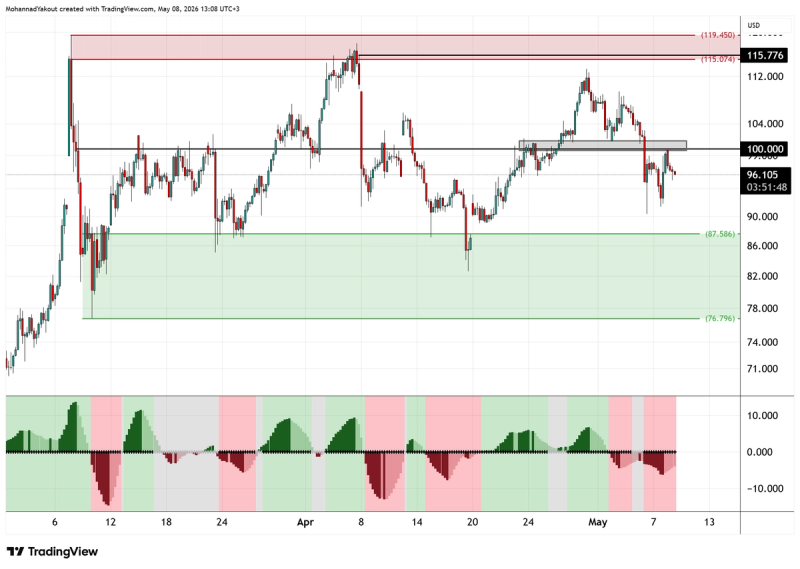
4-Hour Chart
The H4 timeframe for Spot Crude indicates a clear rejection from the overhead supply zone near 115.00. Price has recently dipped back toward the 100.000 psychological level, and the momentum indicator confirms this bearish sentiment with increasing red histograms, signaling that the recent rally has hit a point of exhaustion.
The current market structure suggests that the commodity is entering a corrective phase. Consequently, a move lower is anticipated to seek liquidity within the broad demand zone located between 76.80 and 87.50. A failure to hold the current local support would provide further confirmation of this descent toward the green demand area.
S&P 500
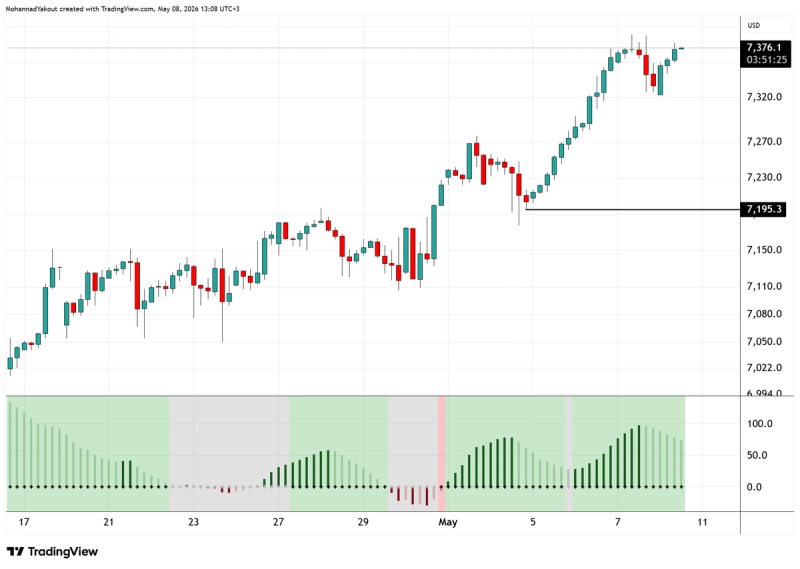
4-Hour Chart
The US500 H4 chart highlights a robust and sustained bullish trend, characterized by a series of aggressive higher highs. This strength is mirrored by the momentum indicator, which remains firmly in the green, indicating that institutional buying interest continues to drive the index upward without significant signs of cooling.
The market structure remains exceptionally bullish as long as price continues to trade above the last major support level identified at 7,200. Any minor intraday pullbacks should be viewed as corrections within a larger uptrend, with the expectation that the index will continue to seek new highs provided the 7,200 floor remains intact.
USDJPY
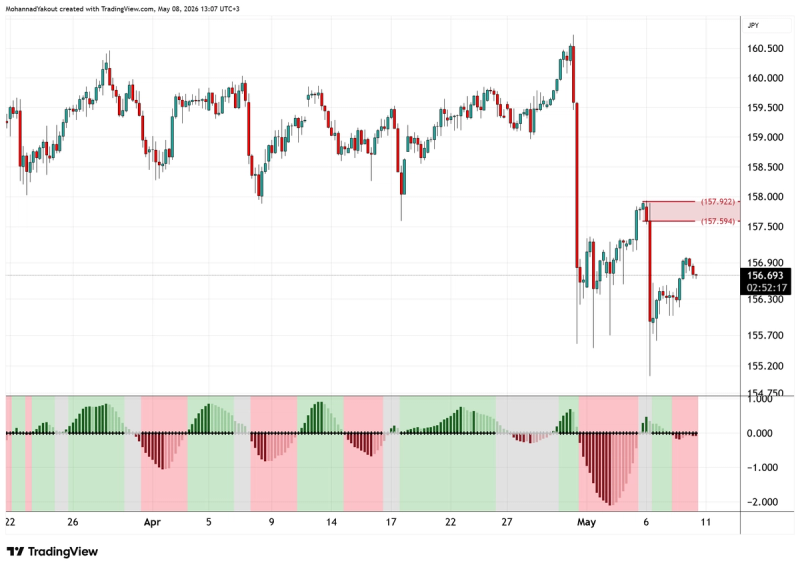
4-Hour Chart
On the H4 timeframe, USD/JPY is currently reacting to a highlighted selling zone situated between 157.60 and 157.90. After a period of extreme volatility, price has retraced into this specific supply area, where it is now encountering renewed selling pressure and a lack of upward follow-through.
The momentum indicator is beginning to show signs of exhaustion, transitioning toward a bearish bias as price struggles to penetrate the resistance ceiling. This setup suggests that the highlighted zone is acting as a primary pivot for sellers. A failure to break and hold above 157.90 would likely initiate a fresh leg lower, confirming the dominance of the supply zone.
This material is a marketing communication provided for informational purposes only and does not constitute investment advice, recommendation, or an offer or solicitation to trade. Any market analysis, opinions, or forecasts are based on publicly available information and do not constitute independent investment research. Past performance and forecasts are not reliable indicators of future results. Scope Markets accepts no liability for any loss arising from reliance on this information.
Related Articles

Technical Scope: No changes in technicals, or fundamentals!
By Mohanad Yakout
Welcome to today’s edition of The Technical Scope, your twice-weekly guide to the evolving landscape of global markets through the lens of technical a...
Read More
Market Analysis
Technical Analysis
Swing Trading

Technical Scope: The Strong Dollar Effect
By Mohanad Yakout
Welcome to today’s edition of The Technical Scope, your twice-weekly guide to the evolving landscape of global markets through the lens of technical a...
Read More
Market Analysis
Technical Analysis

Technical Scope: Markets stuck in a sideways range
By Mohanad Yakout
Welcome to today’s edition of The Technical Scope, your twice-weekly guide to the evolving landscape of global markets through the lens of technical a...
Read More
Market Analysis
XAUUSD
USDJPY
US 500
Trend Following
Technical Analysis
Swing Trading
Support And Resistance

Stop Trading the News, Start Trading the Oil Cargo
By Victor Golovtchenko
When you see a Reuters headline that tells you OPEC+ is "completing the series of symbolic quota hikes," what exactly are you trading? When the Irania...
Read More
Market Analysis
Oil
US Oil
UK oil
WTI
Brent Crude
Trading

Technical Scope: Markets Mixed Ahead of Key Developments
By Mohanad Yakout
Welcome to today’s edition of The Technical Scope, your twice-weekly guide to the evolving landscape of global markets through the lens of technical a...
Read More
Market Analysis
XAUUSD
USDJPY
US 500
Trend Following
Technical Analysis
Swing Trading
Support And Resistance
The state of Hormuz: oil price action is not the story
By Victor Golovtchenko
Another month, another week, another batch of headlines, and new all-time highs for US stock markets might not be the news one awaits when they see th...
Read More
Market Analysis
Oil
WTI
Brent Crude
Strait of Hormuz
UAE
OPEC
Technical Scope: Key levels to watch for on JPY pairs
By Mohanad Yakout
Welcome to today’s edition of The Technical Scope, your twice-weekly guide to the evolving landscape of global markets through the lens of technical a...
Read More
Market Analysis
Technical Analysis
Day Trading
Chart Patterns
EURUSD
GBPUSD
Crude Oil
S&P 500
Gold

Beyond oil & gold: sector rotation from AI-centric to energy-centric
By Victor Golovtchenko
The vulnerability of the Strait of Hormuz which is handling 20% of global oil flows and a massive share of Qatar’s liquified natural gas (LNG) exports...
Read More
Market Analysis
Stocks
Energy
Tesla

Beyond oil & gold: mapping forex markets in turbulent times
By Victor Golovtchenko
The financial world has understandably been captivated by the extraordinary surge in gold to above $5,000 in the first weeks of 2026 and the looming t...
Read More
Market Analysis
forex
Oil
Gold
Straight of Hormuz
Iran