
Technical Scope: Markets see trend continuations
June 23, 2026 at 3:25 PM
Technical Analysis Today: DXY, EUR/USD, Gold, & S&P 500
Welcome to today’s edition of The Technical Scope, your twice-weekly guide to the evolving landscape of global markets through the lens of technical analysis. This report focuses on pure price action, highlighting key supply and demand zones, tracking momentum shifts, and identifying potential trading opportunities. Each edition covers major assets, offering a broad view of how currencies, commodities, and equities are performing. When market conditions present interesting setups, additional instruments will also be analyzed to provide deeper insight and actionable context.
Today’s edition presents our technical analysis of the following key assets: DXY, EUR/USD, Gold, & S&P 500
Dollar Index
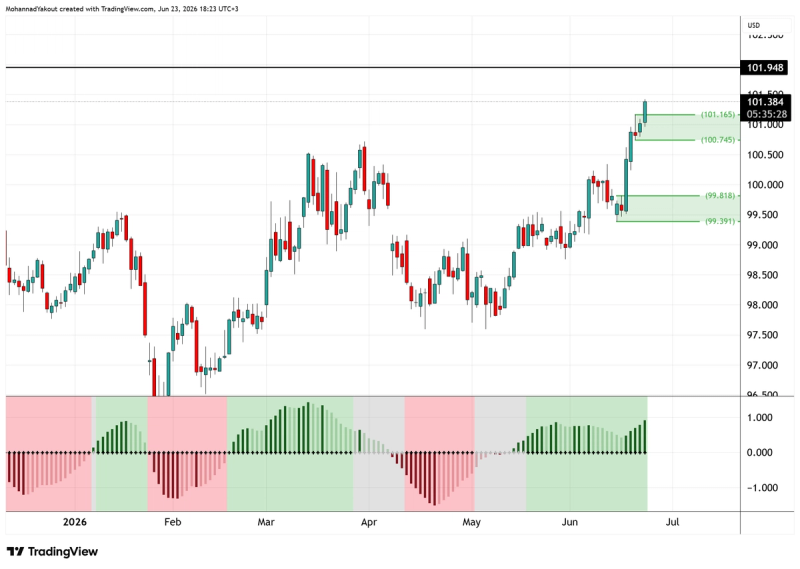
Daily timeframe
The Dollar Index chart reveals a powerful impulsive upward expansion following its prior consolidation phase. Price action has cleanly broken through key psychological resistance zones, turning previous ceilings into established demand levels around 100.745 and 101.165 where buying pressure continues to accelerate. Currently, the index is showing sustained bullish momentum as it drives toward higher structural levels, suggesting a potential continuation of the uptrend.
Traders should monitor for a continued move higher from this breakout area, targeting the major structural resistance level at 101.948. A successful breach of this upper boundary could signal a deeper expansion phase higher into un-tested territory.
EUR/USD
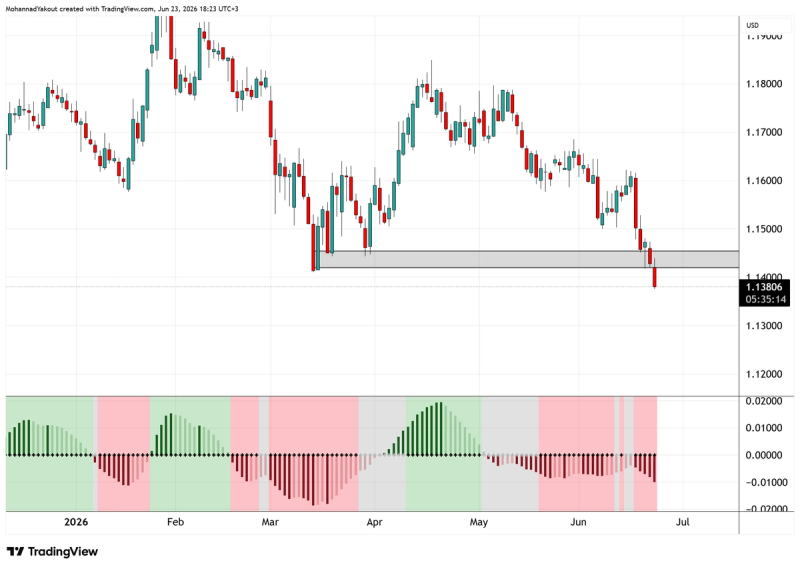
Daily timeframe
The EURUSD chart reveals a defined downward expansion following its breakdown from a major consolidation range. Price action has forcefully penetrated the structural floor represented by the gray support zone around 1.14000, where selling pressure has completely overwhelmed any remaining bids. Currently, the pair is showing signs of strong bearish continuity below this broken level, suggesting a potential continuation of the decline.
Traders should monitor for a continued move lower as long as price action stays below this invalidation zone, targeting the immediate extension levels near 1.13000. A failure by buyers to reclaim this prior support-turned-resistance boundary will likely catalyze a deeper corrective phase lower.
Gold
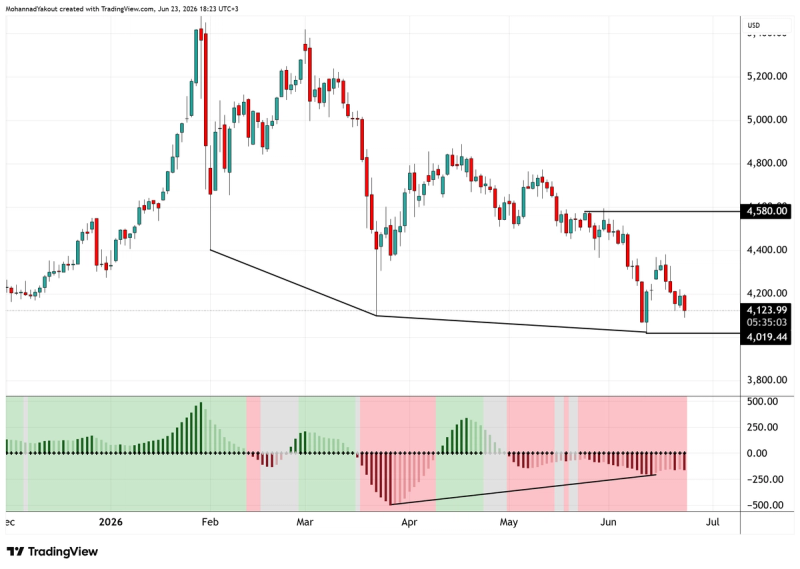
Daily timeframe
The Gold chart reveals a downtrend characterized by a series of lower highs and lower lows despite recent minor corrections. Price action has successfully defended its structural floor, establishing a critical support level near the last major swing low at $4,020 where aggressive buying pressure stepped in. Currently, the metal is showing signs of stabilizing and gathering renewed strength above this defense zone, suggesting a potential rotation back to the upside.
Traders should monitor for a continued move higher from this structural base, targeting the recent peak resistance zone around 4,580. As long as price action stays firmly above the last low, the broader bullish structure remains intact for an eventual continuation higher.
S&P 500
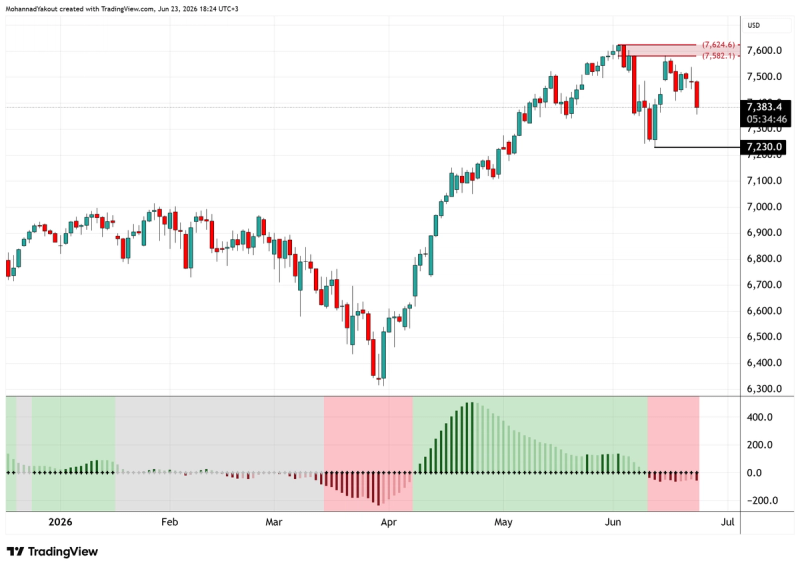
Daily timeframe
The S&P 500 chart reveals a strong overarching uptrend characterized by a series of higher highs and higher lows despite recent minor corrections. Price action has formed a floor, by establishing a support level near the last major swing low at 7,230.0 where buying pressure stepped in. Currently, the index is showing signs of weakness and losing strength above this defense zone, suggesting a potential move lower to retest this support.
Traders should monitor for a continued move lower to this structural base, targeting the recent low support zone around 7,230. As long as price action stays firmly above the last low, the broader bullish structure remains intact for an eventual continuation higher.
This material is a marketing communication provided for informational purposes only and does not constitute investment advice, recommendation, or an offer or solicitation to trade. Any market analysis, opinions, or forecasts are based on publicly available information and do not constitute independent investment research. Past performance and forecasts are not reliable indicators of future results. Scope Markets accepts no liability for any loss arising from reliance on this information.
Related Articles

Technical Scope: Price Action Ahead of the Peace Summit
By Mohanad Yakout
Welcome to today’s edition of The Technical Scope, your twice-weekly guide to the evolving landscape of global markets through the lens of technical a...
Read More
Market Analysis
Price Action
Swing Trading
Technical Analysis

Technical Scope: The Sideways trading continues
By Mohanad Yakout
Welcome to today’s edition of The Technical Scope, your twice-weekly guide to the evolving landscape of global markets through the lens of technical a...
Read More
Market Analysis
Swing Trading
Technical Scope: No changes in technicals, or fundamentals!
By Mohanad Yakout
Welcome to today’s edition of The Technical Scope, your twice-weekly guide to the evolving landscape of global markets through the lens of technical a...
Read More
Market Analysis
Technical Analysis
Swing Trading

Technical Scope: The Strong Dollar Effect
By Mohanad Yakout
Welcome to today’s edition of The Technical Scope, your twice-weekly guide to the evolving landscape of global markets through the lens of technical a...
Read More
Market Analysis
Technical Analysis
Technical Scope: Markets stuck in a sideways range
By Mohanad Yakout
Welcome to today’s edition of The Technical Scope, your twice-weekly guide to the evolving landscape of global markets through the lens of technical a...
Read More
Market Analysis
XAUUSD
USDJPY
US 500
Trend Following
Technical Analysis
Swing Trading
Support And Resistance

Stop Trading the News, Start Trading the Oil Cargo
By Victor Golovtchenko
When you see a Reuters headline that tells you OPEC+ is "completing the series of symbolic quota hikes," what exactly are you trading? When the Irania...
Read More
Market Analysis
Oil
US Oil
UK oil
WTI
Brent Crude
Trading

Technical Scope: Markets Mixed Ahead of Key Developments
By Mohanad Yakout
Welcome to today’s edition of The Technical Scope, your twice-weekly guide to the evolving landscape of global markets through the lens of technical a...
Read More
Market Analysis
XAUUSD
USDJPY
US 500
Trend Following
Technical Analysis
Swing Trading
Support And Resistance
Technical Scope: Key Levels & Market Outlook ahead of NFP Data
By Mohanad Yakout
Welcome to today’s edition of The Technical Scope, your twice-weekly guide to the evolving landscape of global markets through the lens of technical a...
Read More
Market Analysis
Chart Patterns
Candlestick Patterns
Day Trading
GBPUSD
Gold
NFP
Non Farm Payrolls
EURUSD
Oil
S&P 500
US 500
USDJPY
XAUUSD
The state of Hormuz: oil price action is not the story
By Victor Golovtchenko
Another month, another week, another batch of headlines, and new all-time highs for US stock markets might not be the news one awaits when they see th...
Read More
Market Analysis
Oil
WTI
Brent Crude
Strait of Hormuz
UAE
OPEC
Technical Scope: Key levels to watch for on JPY pairs
By Mohanad Yakout
Welcome to today’s edition of The Technical Scope, your twice-weekly guide to the evolving landscape of global markets through the lens of technical a...
Read More
Market Analysis
Technical Analysis
Day Trading
Chart Patterns
EURUSD
GBPUSD
Crude Oil
S&P 500
Gold